

Live dashboards
One live performance view
Calls, sales and service belong in the same picture. Bring data from multiple systems together on one dashboard, so your team can see what matters and act while it matters.
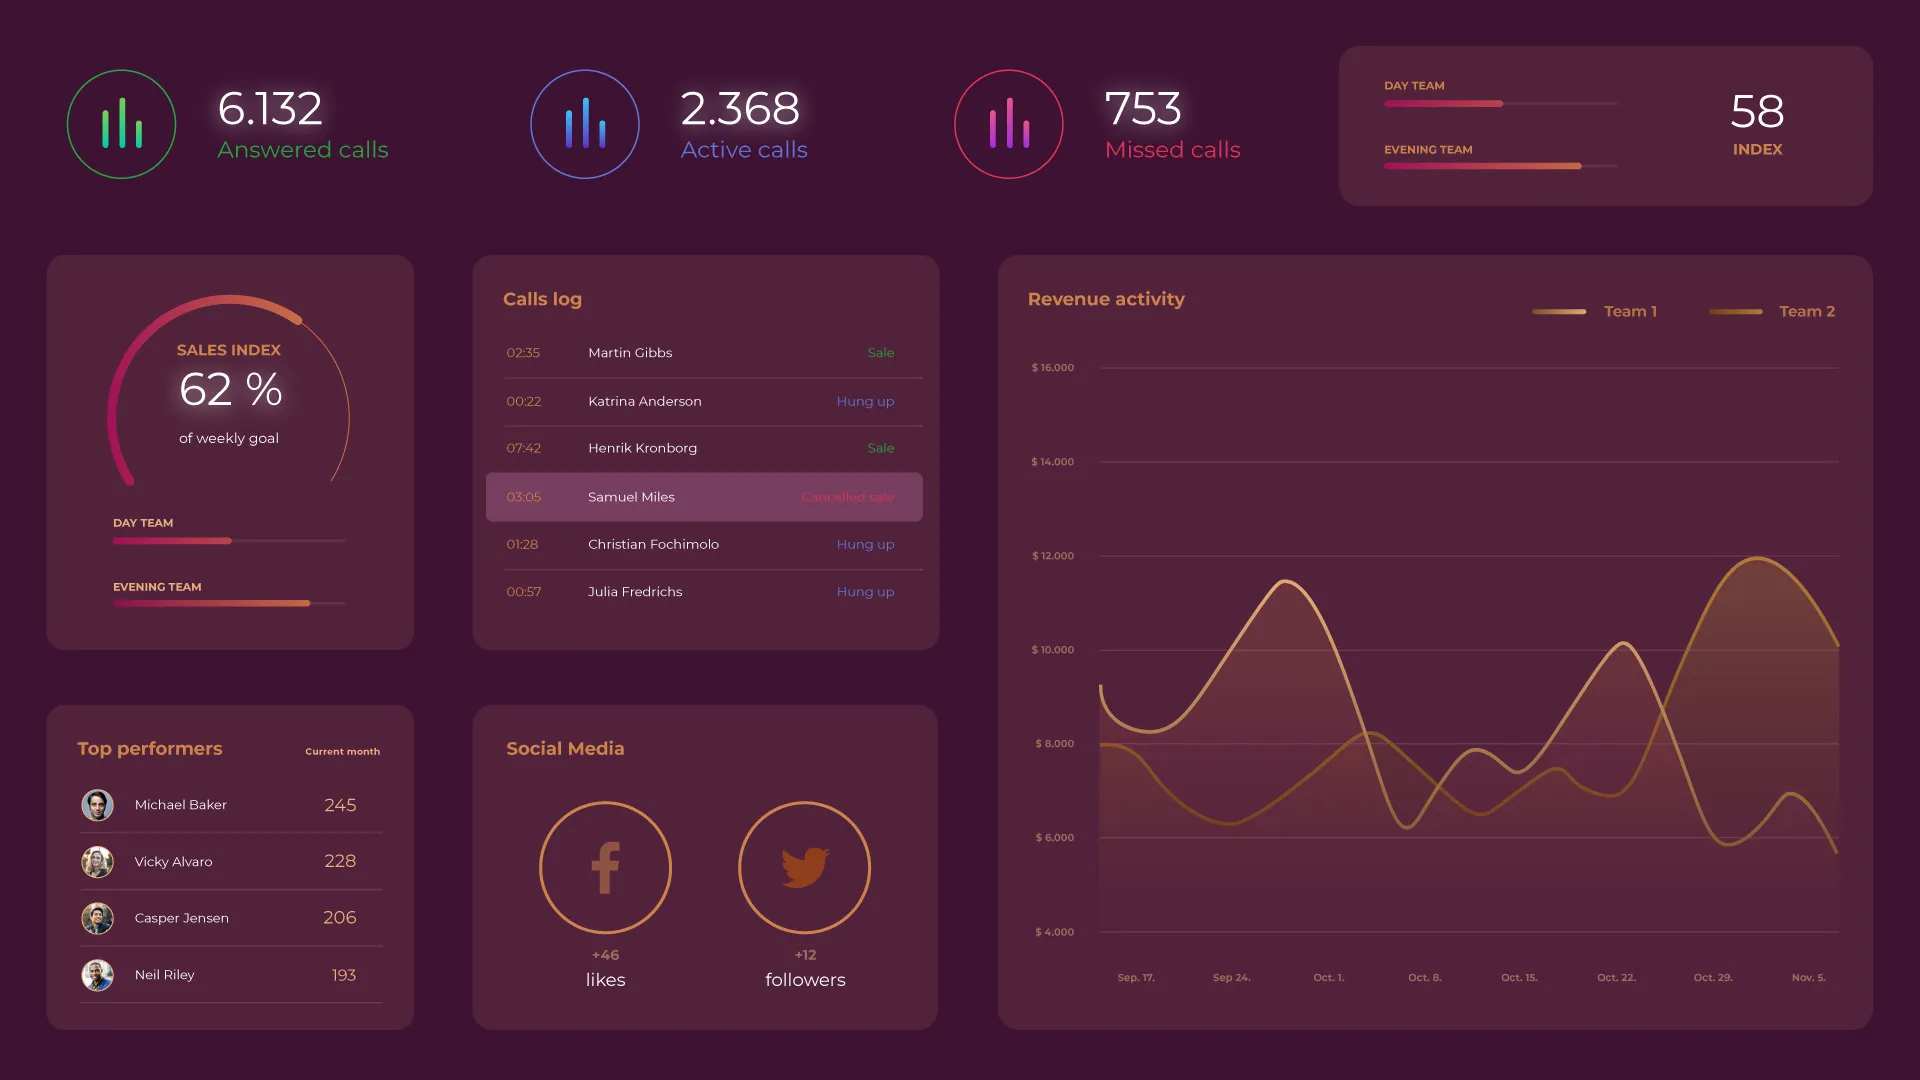
- LiveData from your tools
- One viewAcross teams and channels
- Your wayTemplates, widgets and themes
- Every screenPersonal, team and TV views
Different systems. Shared perspective
Connect your data
Your calls live in one system. Your sales in another. Your customer service somewhere else. IntraManager brings data from several connected systems into the same dashboard, giving managers and teams a shared view across the operation.
- See telephony, CRM and support data side by side
- Spot trends across teams and systems in one view
- Share the whole picture instead of separate reports


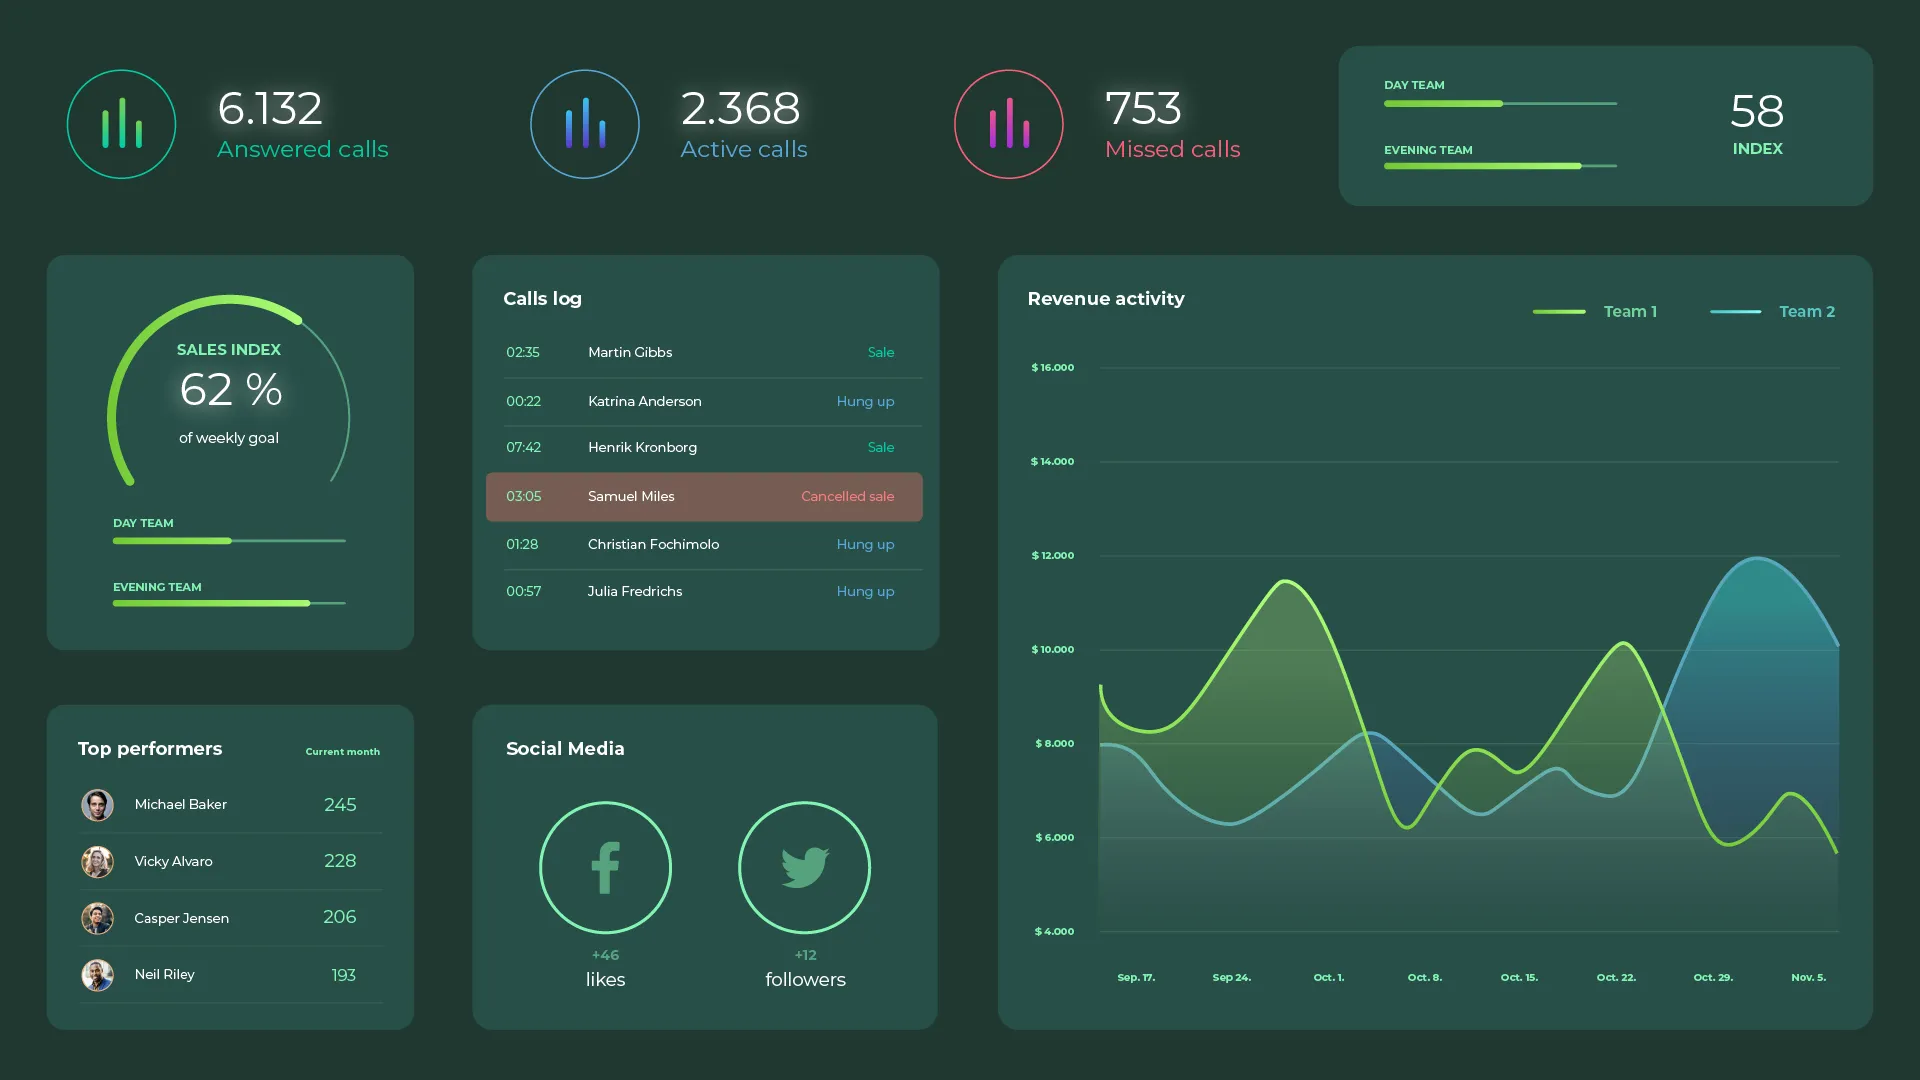
Illustrative dashboard
Your systems, connected
Connect the systems your team already uses and give their data a shared home in IntraManager.
Built around your operation
Context for every KPI
A number, a trend, a target or a team comparison. Arrange the widgets that make your data easy to understand and your next move easier to see.
Start with a template
Create a useful first view quickly with dashboard templates designed to make key information easy to understand.
Build with flexible widgets
Use the visual editor to arrange smart widgets and give every metric the right context.
Define your KPIs
Use the included KPIs from connected tools or create your own to follow the measurements that matter most.
From systems to shared focus
From data to action
Start with the tools you already use, decide what deserves attention and share the result where your teams work.
Connect your data
Bring live information from your contact center tools into one place.
Build the right view
Choose a template or arrange widgets around the goals and KPIs that matter.
Share and improve
Display performance on personal dashboards, team dashboards and TV screens.
Same data. A different atmosphere
Your team's view
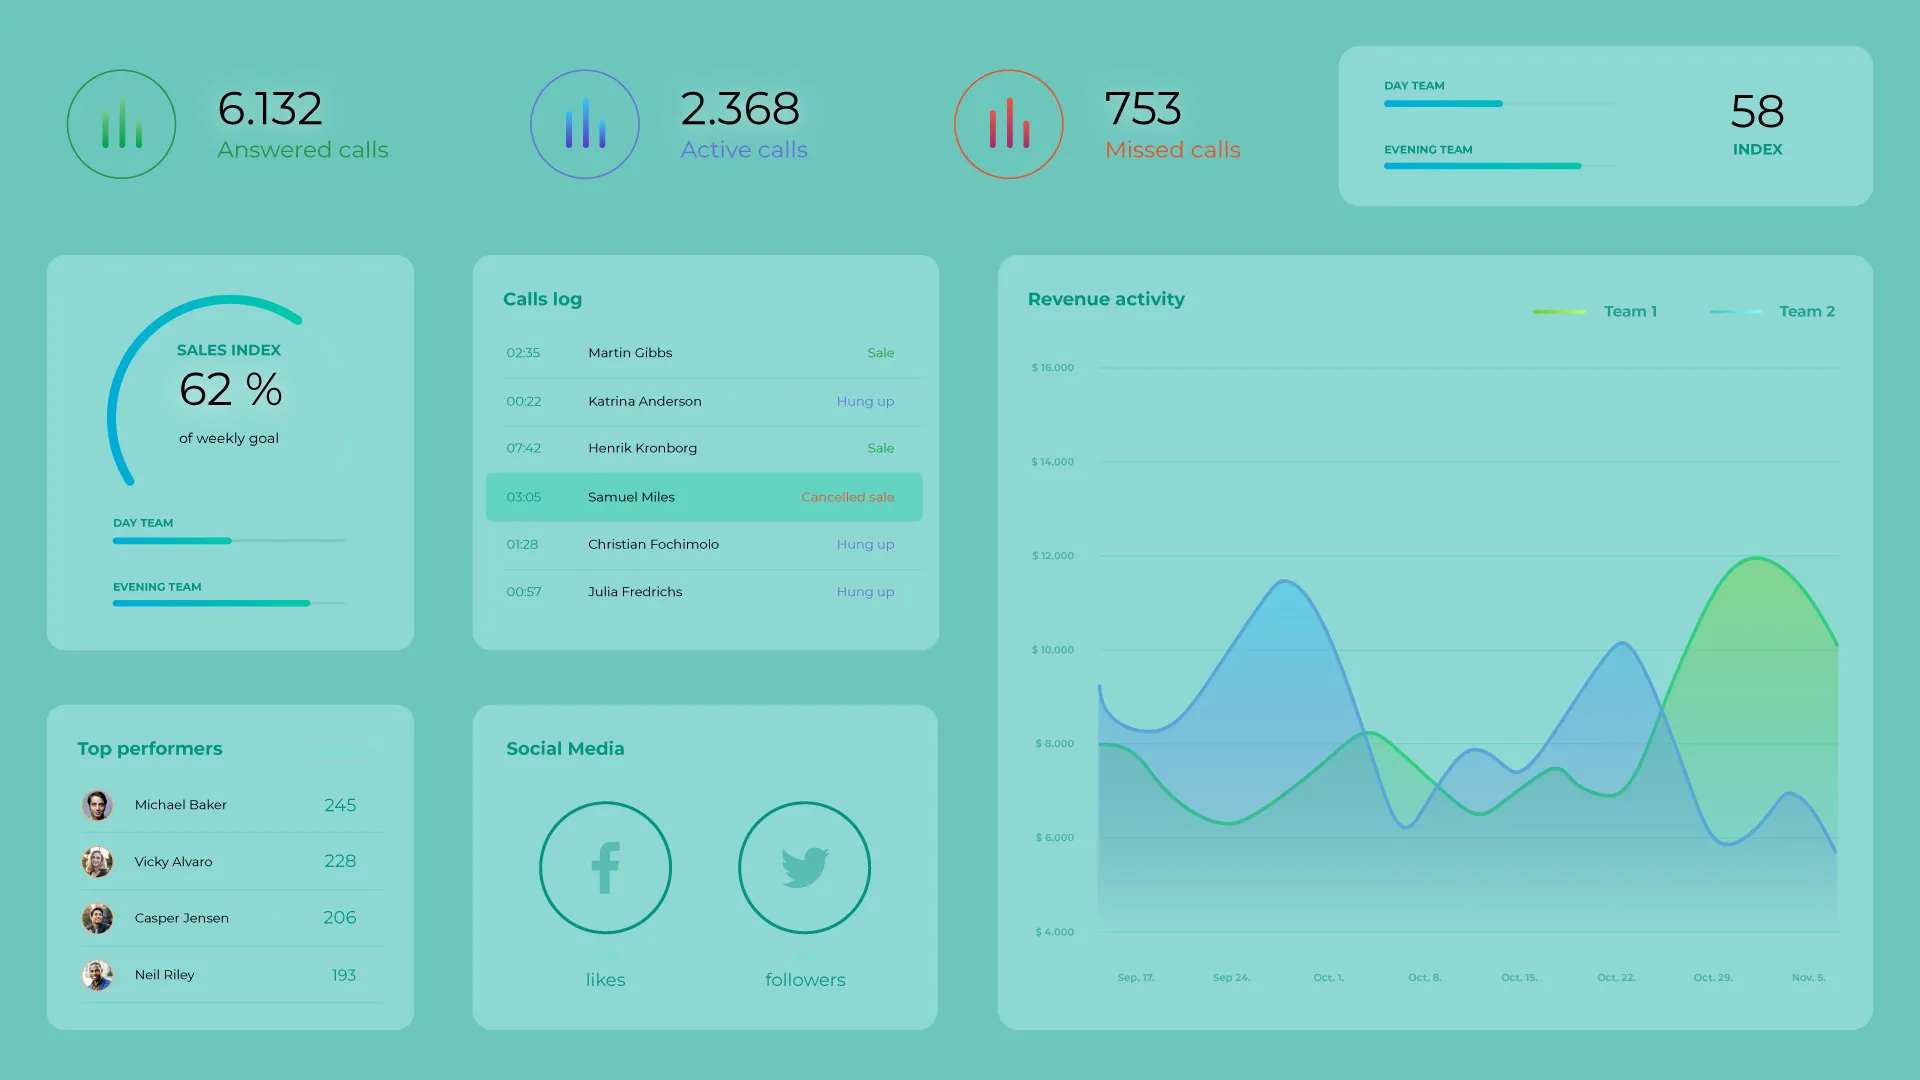
Keep the performance picture. Change the mood. Explore everyday colors, distinctive styles and seasonal themes.
Your dashboard, your style
Choose an included theme or use the colors that already shape your contact center’s visual identity.
From your desk to the whole team
Performance on every screen
Personal dashboards, shared team dashboards and TV screens bring the same performance story into everyday work.
Slideshows
Combine dashboards and games in a rotating slideshow, including inside a live dashboard.
Gamification
Make performance work more engaging and visible for the team.
Notifications
Highlight results and make important performance moments stand out.
TV sharing
Manage what is shown across shared screens from one central place.
Make performance visible
Share your performance view
Try IntraManager free for 30 days and build your first dashboard with your own data and priorities.